How to use short keys in Xcode?
How to jump forward/ backward?
Cmd + Ctrl + ←
How to show/ hide project navigator?
Cmd + 0
How to collapse/ expand current code block?
Option + Cmd + Left/ Right Arrow
How to show/ hide debug console?
Cmd + Shift + Y
How to capture API calls?
Use Wormholy
- Add wormholy into Podfile
pod 'Wormholy', :configurations => ['Debug']
- Use hotkey Ctrl + Command + Z to open it
Use Postman Proxy
- Make sure your Mac and your iOS connecting to the same network
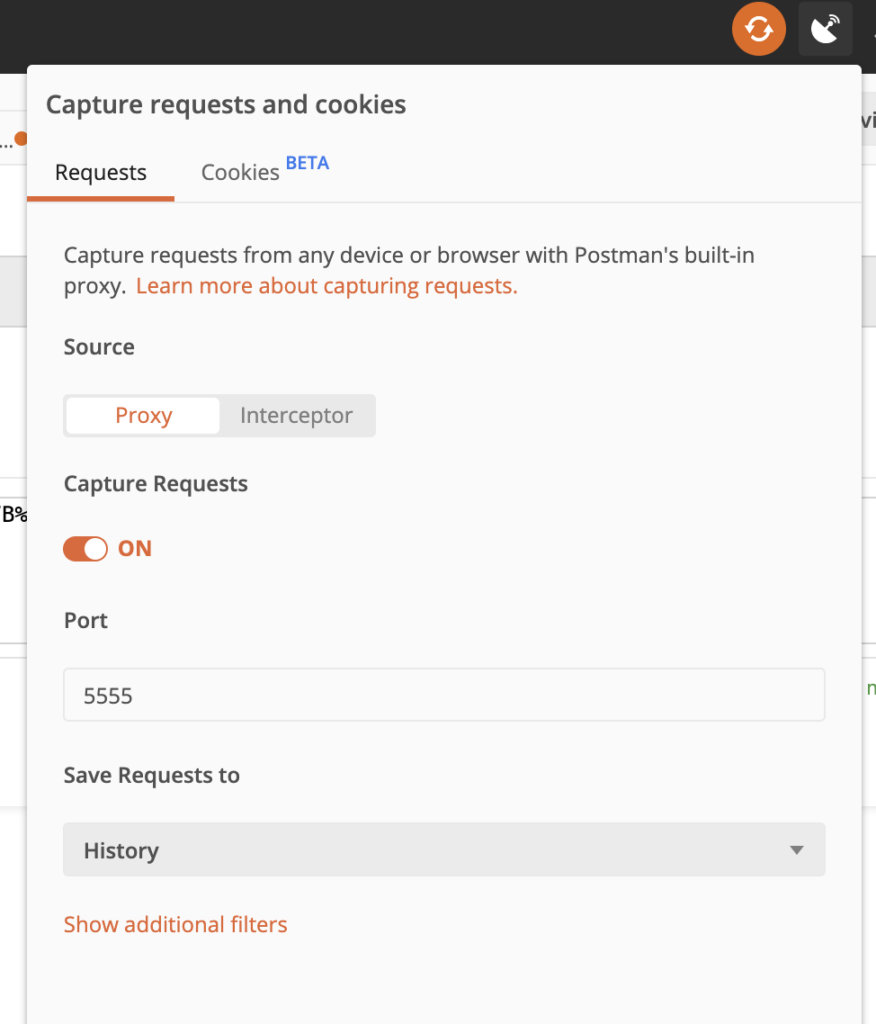
- Turn on “Capture Request”

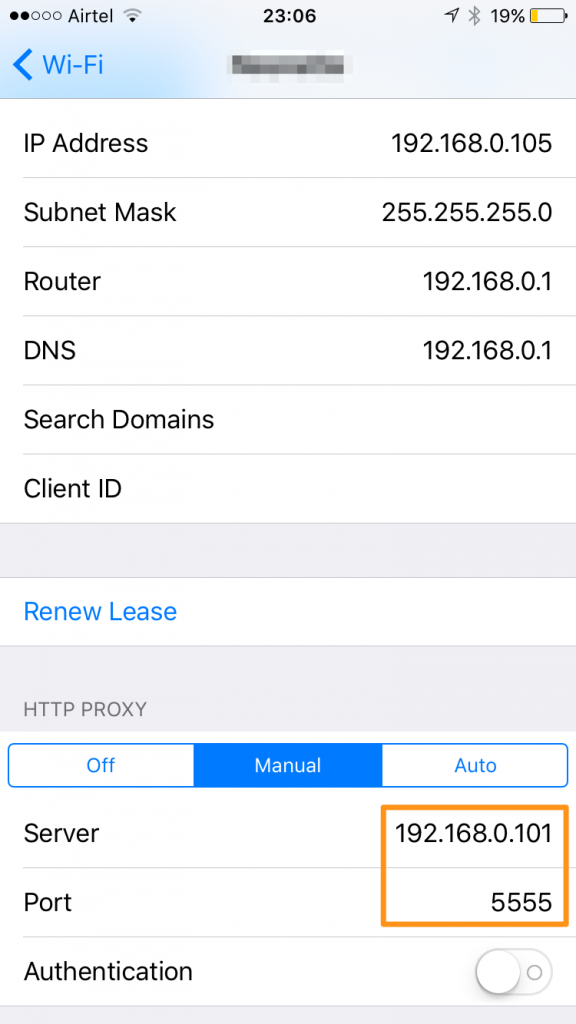
- Configure HTTP Proxy on your mobile device
- Server: is LAN IP of your Mac
- Port: is number set in Postman

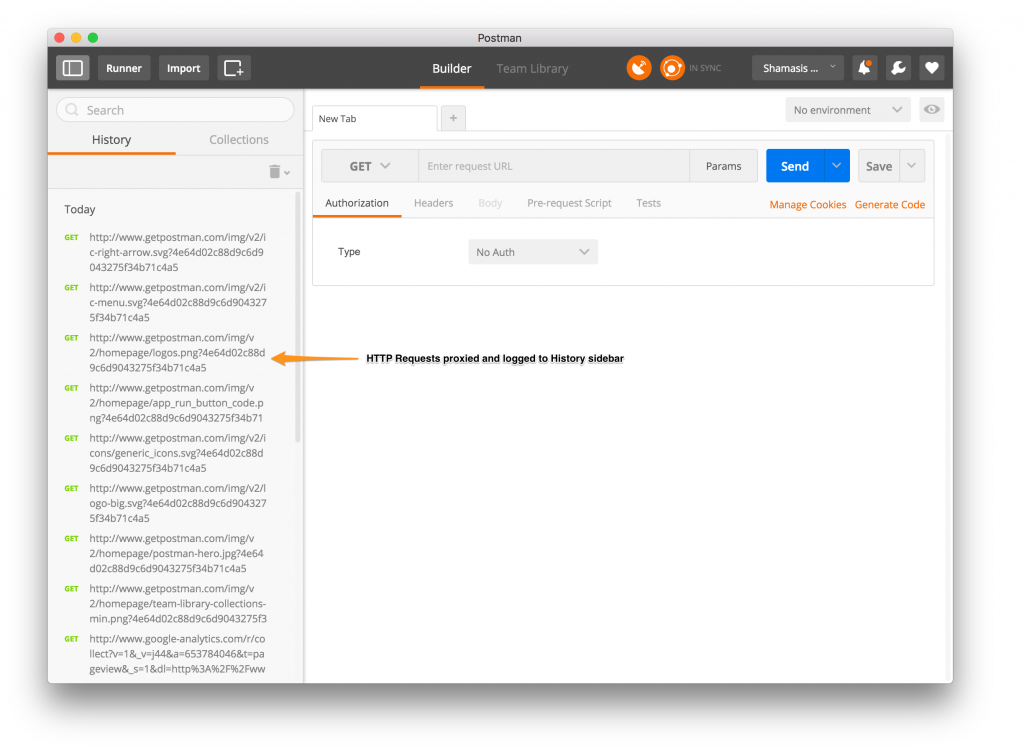
- You can see API requested from Postman history from now on

Use mitmproxy
- Install
brew install mitmproxy - Run this from CLI
mitmproxy or mitmdump or mitmweb - Configure HTTP Proxy on your mobile device as Postman except the port number used here is 8080
- Change port number
mitmproxy --listen-port #PORTNOmitmweb --listen-port #PORTNO
- Change port number
- Reference
How to debug iOS device over Wifi?
- Open your project on Xcode
- Plugged in your iPhone with USB cable
- Open Window > Devices and Simulators
- Select Devices from the top, Select your device from left and Check the “Connect via network” box
- Unplug your USB cord
Breakpoint tips
Breakpoints not hit
Go to Product -> Scheme -> Edit Scheme, under Run – Info. Check “Debug Executable” in that menu
How to turn off garbage log?
You may see frequent log messages related to nw_connection_get_connected_socket or finished with error – code : -1001. These are due to attempted connections to the React debugging tools.
Silence these temporarily by going to Product \ Scheme \ Edit Scheme and finding the Arguments tab of the Run config. Add a new environment variable called “OS_ACTIVITY_MODE” with the value “disable”
Errors
Why can’t I use XCode Profiler to see network activities?
It’s because the XCode Profiler is used for real devices only
Leave a Reply